In today’s high-speed, multi-shift printing environment, unplanned downtime is the enemy of profitability. A curing issue on a flexographic label press or a sheetfed offset machine can halt an entire production line, leading to wasted material, missed deadlines, and frustrated customers. Traditional reactive maintenance—waiting for a failure to occur—is no longer viable. The modern solution lies in proactive, data-driven management through remote monitoring and diagnostics. This tutorial provides a comprehensive, step-by-step guide for implementing and utilizing remote monitoring for your UV curing systems, transforming them from isolated components into intelligent, connected assets that communicate their health and performance in real time.
Step 1: Understanding the System Architecture and Connectivity
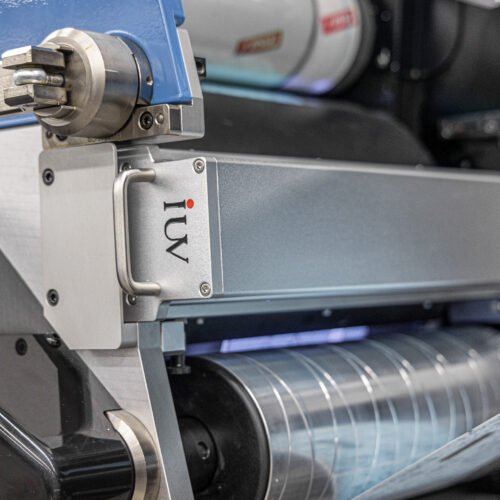
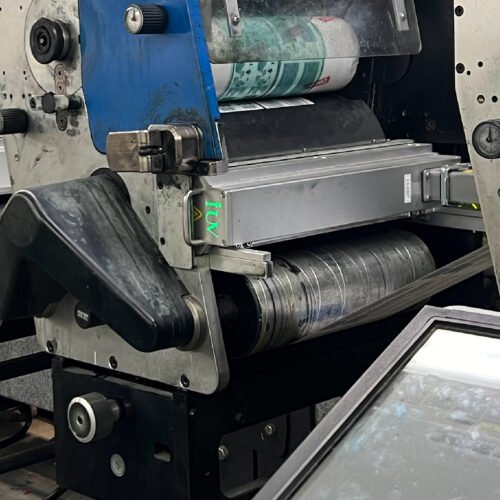
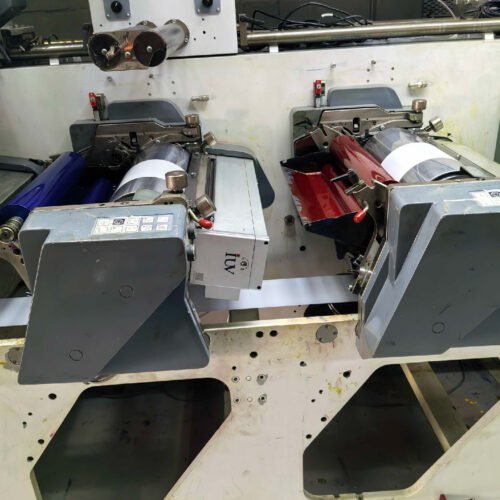
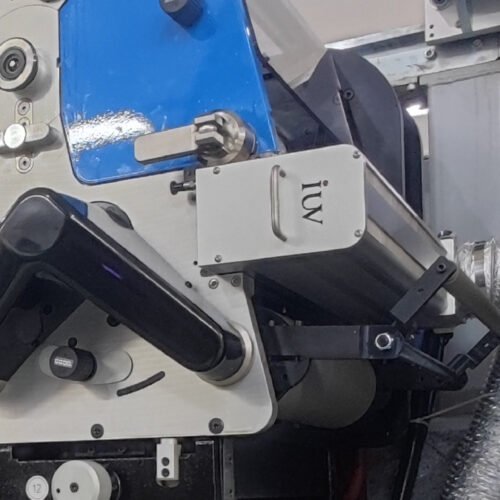
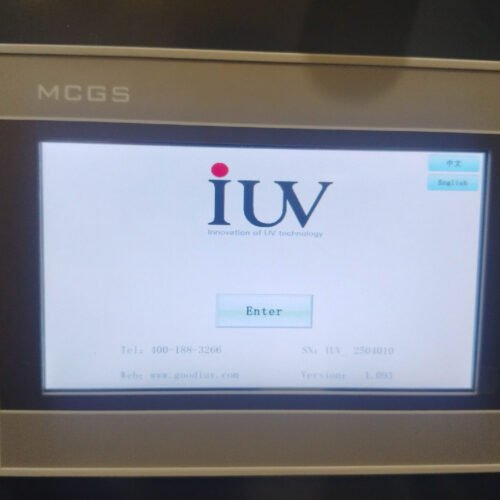
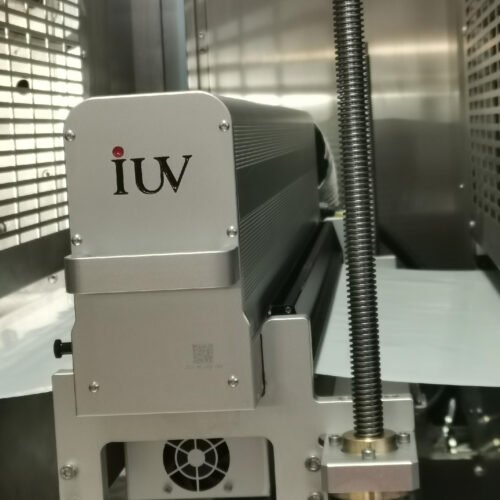
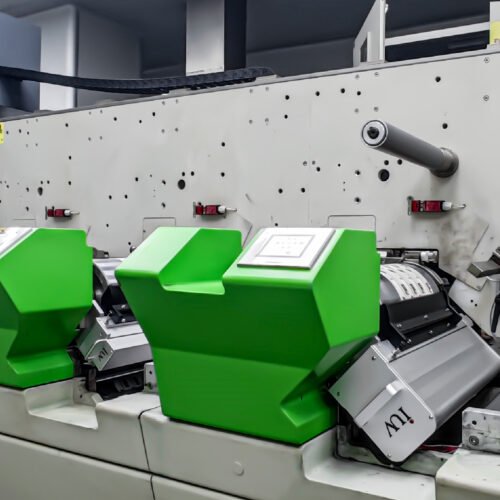
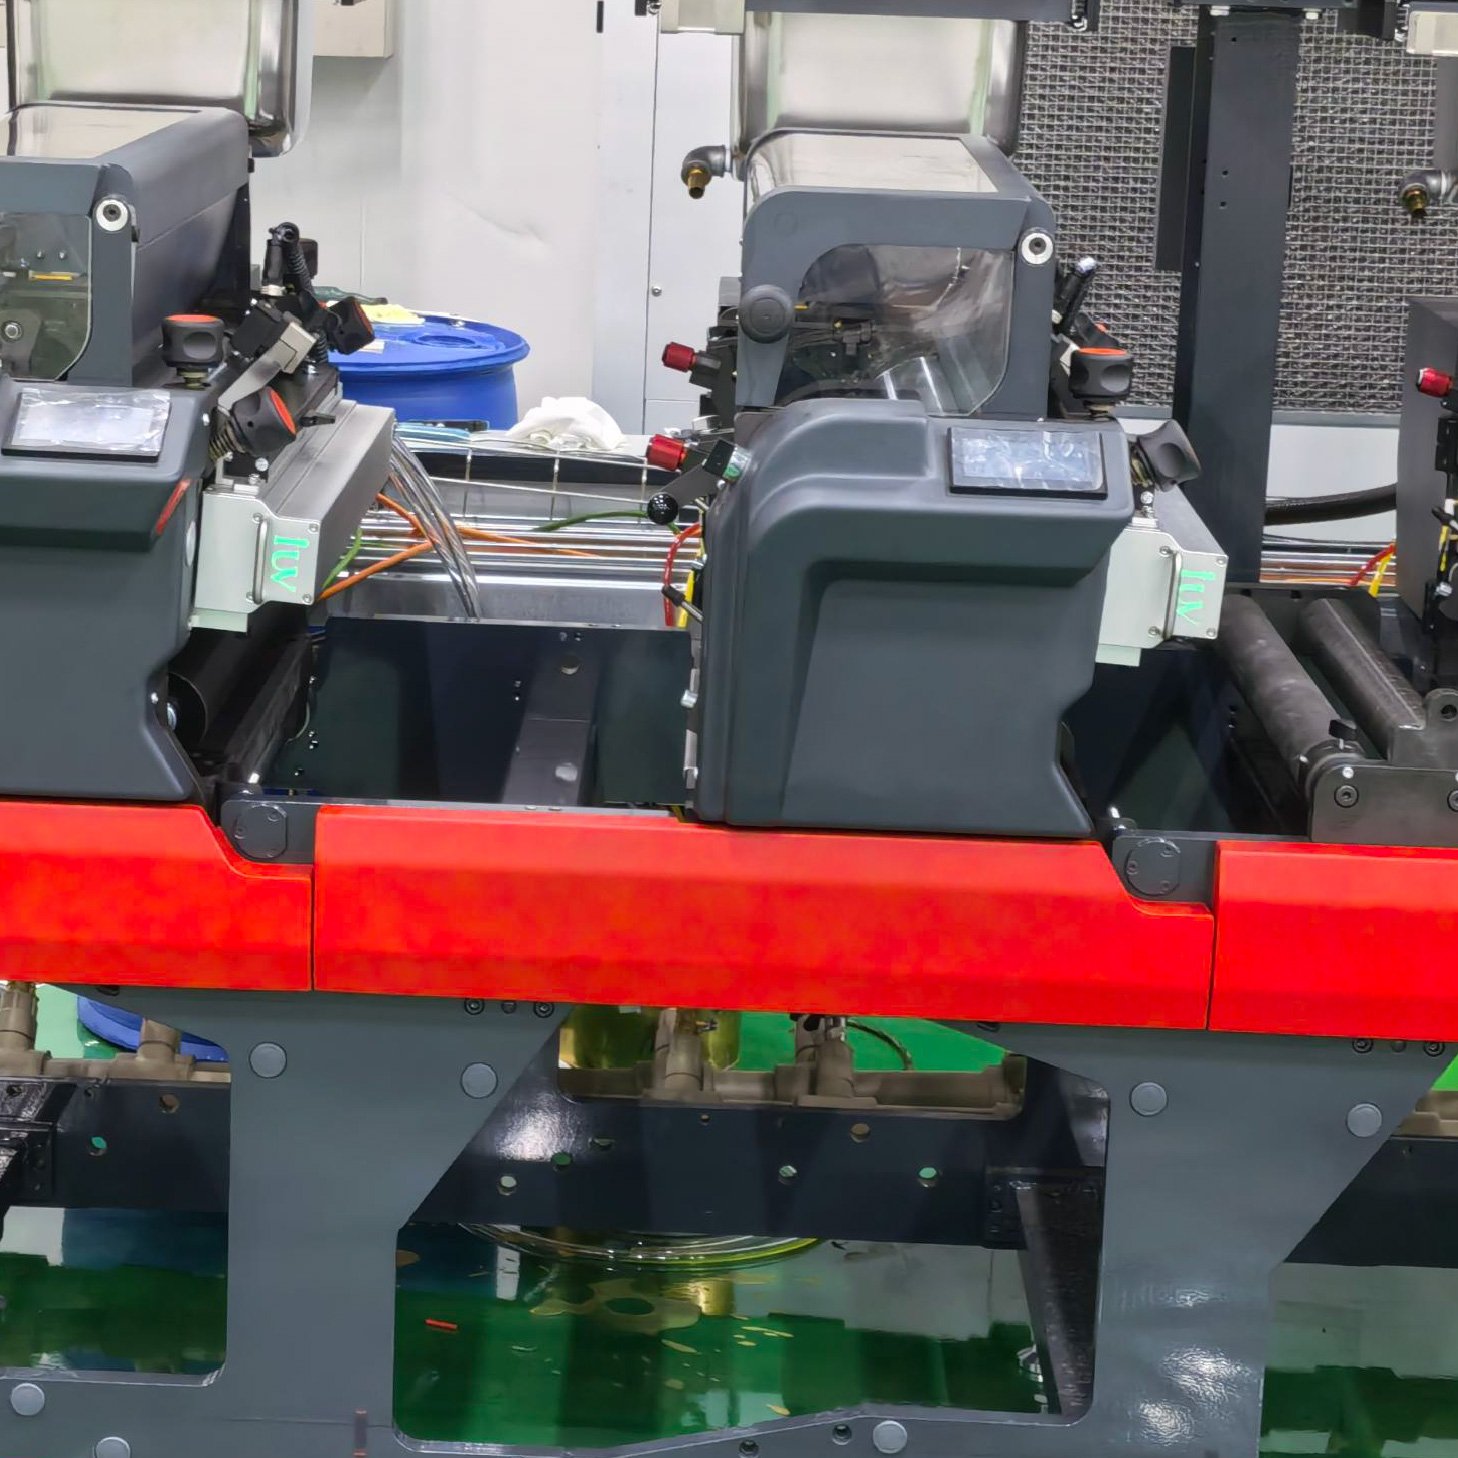
Before diving into data, you must understand the physical and digital architecture of a modern, monitor-ready UV system. At its core, such a system is built on a modular power supply and control architecture. Each UV lamp head (LED or mercury) is driven by its own intelligent power module. These modules are equipped with sensors that continuously measure critical parameters: output current (mA) to each LED array or lamp, operating temperature at the heat sink, cooling system flow rate (for water-cooled units), and internal voltage states. This data is aggregated by a central controller, often with an integrated Human-Machine Interface (HMI) touchscreen. The crucial link for remote access is the controller’s communication gateway, which supports standard industrial protocols (e.g., Ethernet/IP, Profinet) and secure connections via wired Ethernet or Wi-Fi to your plant network and ultimately to a cloud portal.
Step 2: Accessing the Dashboard and Key Performance Indicators (KPIs)
Once connected, you access the system through a secure web-based dashboard or a dedicated mobile app. The dashboard presents a hierarchical view, typically showing all presses and their individual curing stations. The primary KPIs you must monitor daily include:
- Real-Time UV Output Current: This is the most direct indicator of lamp health. For LED systems, a stable current reading (e.g., 2000 mA as shown in system states) confirms normal operation. A gradual decline or fluctuation in current can signal LED aging, cooling issues, or power supply problems.
- Operating Temperature: LED efficiency and lifespan are critically dependent on junction temperature. The dashboard displays the setpoint and actual temperature (e.g., Temp Set 23.0°C, Current Temp 0°C at idle). Consistent overheating alarms indicate blocked filters, failing pumps, or low coolant levels.
- System State and Alarm History: A clear “OK” status for each module (UV1, UV2, etc.) and the main power supply is essential. The alarm history log provides a timestamped record of all events, from minor warnings to critical faults, which is invaluable for trend analysis.
- Operational Hours (Used Time): Tracking the total runtime of mercury lamps is vital for predictive replacement before they fail and cause a print quality defect. For LEDs, this metric helps validate the long-life claim and forecast maintenance cycles.
Step 3: Performing Routine Diagnostic Checks and Data Logging
Remote monitoring enables scheduled diagnostic routines without physical intervention. Weekly, you should perform these virtual checks:
- Review Energy Consistency: Check that the UV energy output across all zones of a wide-web system remains within the specified uniformity tolerance (e.g., ±3%). A deviation might suggest a dirty optical lens or a failing LED array in a specific zone.
- Analyze Cooling Performance: Monitor the temperature differentials and pump status. For systems with combined water-air cooling, ensure the intelligent control is balancing both methods effectively to handle the heat load in confined press spaces.
- Verify Communication Integrity: Confirm that all modules report back without communication timeouts. A missing module on the dashboard could indicate a loose network connection or a faulty module controller.
- Export Performance Reports: Use the dashboard’s export function to download weekly or monthly performance logs. This data is crucial for demonstrating ROI, planning preventative maintenance, and providing evidence to equipment or ink suppliers if a technical dispute arises.
Step 4: Executing Remote Troubleshooting and Support Collaboration
When an alarm triggers, remote diagnostics turn crisis management into a streamlined procedure. Follow this sequence:
- Immediate Assessment: Log into the dashboard from any location. Don’t just read the alarm code (e.g., “0x0 OK” or an error code); examine the correlated data. An “Over Temp” alarm coupled with a zero coolant flow reading clearly points to a pump failure.
- Safe Remote Commands: Authorized users can often execute soft resets, toggle cooling fans, or adjust power limits remotely to attempt a recovery without sending a technician to the press floor.
- Collaborative Support Session: This is where the value multiplies. Using secure screen-sharing, you can grant the technical support team (like IUV’s global network experts) real-time, read-only access to your dashboard. They can see exactly what you see—system states, historical graphs, error codes—and guide your on-site personnel through precise corrective actions. This collaborative approach slashes mean time to repair (MTTR) from days to hours.
Step 5: Leveraging Remote Updates and Predictive Analytics
The most advanced remote systems offer two forward-looking capabilities:
- Secure Firmware Over-The-Air (OTA) Updates: The system software can be upgraded through encrypted channels. This means your curing system can receive performance enhancements, new features, or improved control algorithms without any physical service visit, ensuring it benefits from continuous innovation.
- Trend Analysis for Predictive Maintenance: By observing long-term trends in operating current and temperature, you can predict failures before they happen. A steady, slow creep in the current required to maintain a set UV intensity might indicate LED degradation, allowing you to schedule a module replacement during a planned maintenance window, not during a production run.
Conclusion: Transforming Curing from a Cost Center to a Data-Driven Advantage
Implementing remote monitoring and diagnostics is not just about fixing problems faster; it’s about preventing them altogether and optimizing the entire printing process. By following this step-by-step guide, you move from a reactive posture to one of proactive control. You gain unprecedented visibility into the heart of your curing process, enabling data-driven decisions that boost uptime, ensure consistent print quality, and extend equipment life. In an era of smart manufacturing (Printing 4.0), a remotely monitored UV curing system becomes a cornerstone of operational excellence, providing the reliability and insight needed to stay competitive in the demanding markets of label, packaging, and commercial printing.